Perspectives: Asset Management
A Deep Dive Into the Asset Management Market
Understanding Southeast Asia’s Asset Management landscape through diving into the following:
- The Global Asset Management Market and Value Chain
- Priority Verticals and Key Success Factors of Global Precedents
- Asset Management Opportunities in Southeast Asia
AI and Next-Gen Wealth Drive Demand for Diversified Wealth Management Platforms
Increasing demand for platform outsourcing and portfolio diversification is driving change across the space, and 3 primary verticals have emerged to capture evolving client needs.
Fig 1. Global Asset Management Market
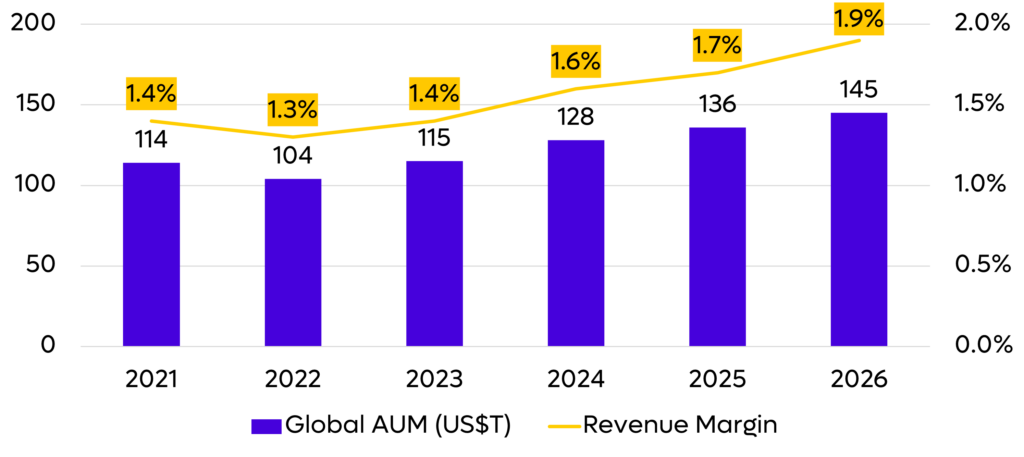
Global Asset Management Market Overview
Global AUM remains large at approximately US$136T in 2025 est. (refer to Figure 1), implying 6% CAGR from 2024, whereas industry revenue margin is at 1.7% the same year and expanded modestly over the picture14
The following are the market’s key drivers:
-
- Steady Rise of HNWI Globally: Global HNWI population is estimated at 59.9M in 2025 and projected to reach 67.7M by 2028. This implies a steady 4.5% annual growth rate—more than four times the pace of global population growth, which averages around 1% per year.
- HNWIs’ Strong Preference for Diversified and Digitally-Enabled Wealth Solutions: Diversity of asset classes and degree of digital capability are key priorities for HNWIs, especially millennial heirs in selecting financial advisors. HNWIs are currently investing in several forms of non-traditional assets such as cryptocurrency and ESG focused funds/products.
- Strong AI Advancement: Robo-advice AUM is estimated to reach a strong CAGR of 19.3% from 2022 to 2027. This market is currently valued at US$2.5T and is projected to grow to US$5.9T by 20273.
Wealth Management Verticals within the AM* Space
Fig 2. Wealth Management Value Chain
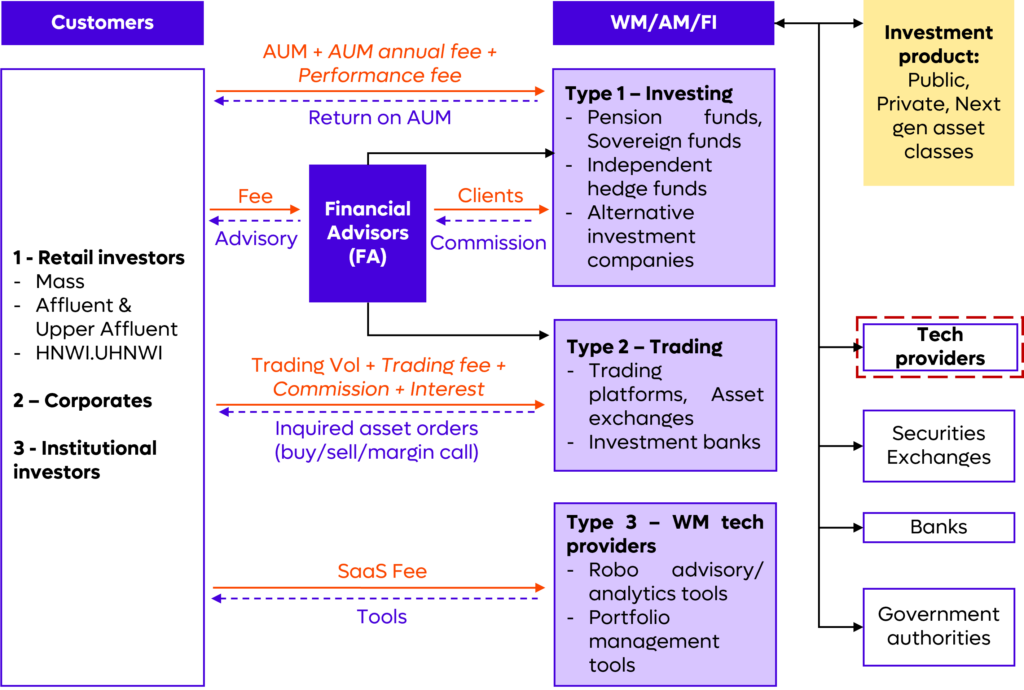
- Investment Management Platforms
-
- This vertical serves retail (B2C) and corporate (B2B) investors by giving access to non-traditional asset classes and providing advisory services (e.g., financial planning and portfolio structure).
- Trading and Brokerage Platforms
- This vertical serves retail and corporate investors, however their product offerings are mostly centered around trading services (e.g., executing trades in public exchanges and providing trading loans).
- Wealth Management Tool Providers
- This vertical provides B2B (e.g., FIGs) and B2C (e.g., financial advisors) players across the entire AM value chain, access to wealth management tools (e.g., robo-advisory, portfolio monitoring).
Source: PWC Global LLC1, EY Global Limited2, Oliver Wyman Consulting3, BCG4 *AM – Asset Management
Investment and Trading Platforms Pivot to Adapt to Emerging Trends
Key characteristics include integration of key use cases, product diversification, and strategic partnerships with complementary businesses to tap underserved markets and sustain growth
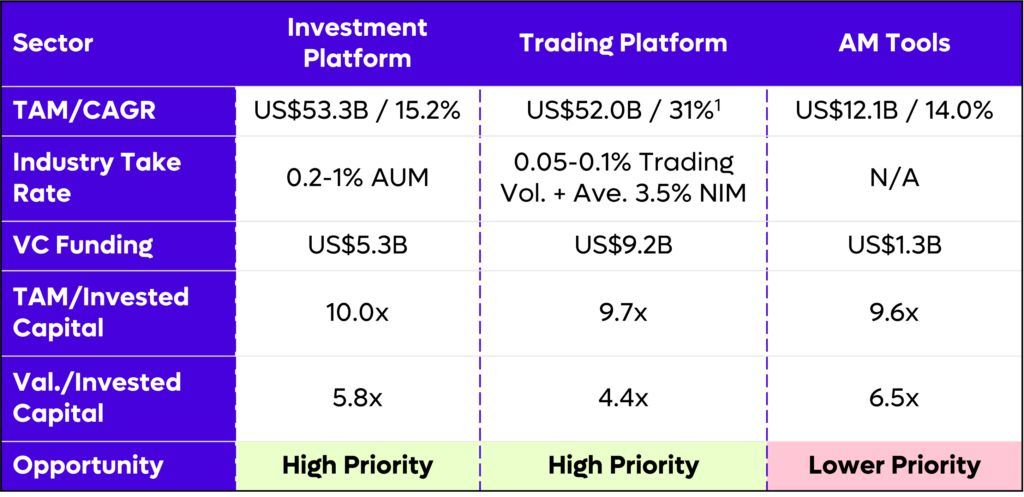
Fig 3. Vertical Side-By-Side
Priority Verticals
Figure 3 presents a side-by-side comparison of 3 high-potential verticals within the AM space, selected due to their strong performance in the following key metrics: TAM/CAGR, Industry Take Rate, VC Funding, TAM/Invested Capital, and Val./Invested Capital. Below are the significant findings from this comparative analysis (refer to Figure 3):
- Investment Platform: With the highest TAM and the most attractive TAM/Invested capital ratio, this vertical is preferred as it maintains stronger unit economics and drives sustainable growth through continued AUM accumulation.
- Trading Platform: With the highest level of VC funding and a TAM and TAM/Invested Capital ratio second only to investment platforms, this vertical operates in a sizable market, though its growth is more cyclical and therefore recurring revenue is lower.
- AM Tools: This vertical shows weaker performance in key metrics like TAM and VC funding, making it a lower priority compared to others.
Given these, the Investment Platform and Trading Platform verticals were prioritized in conducting a further deep dive.
Global Key Takeaways
Fig 4. Case Studies
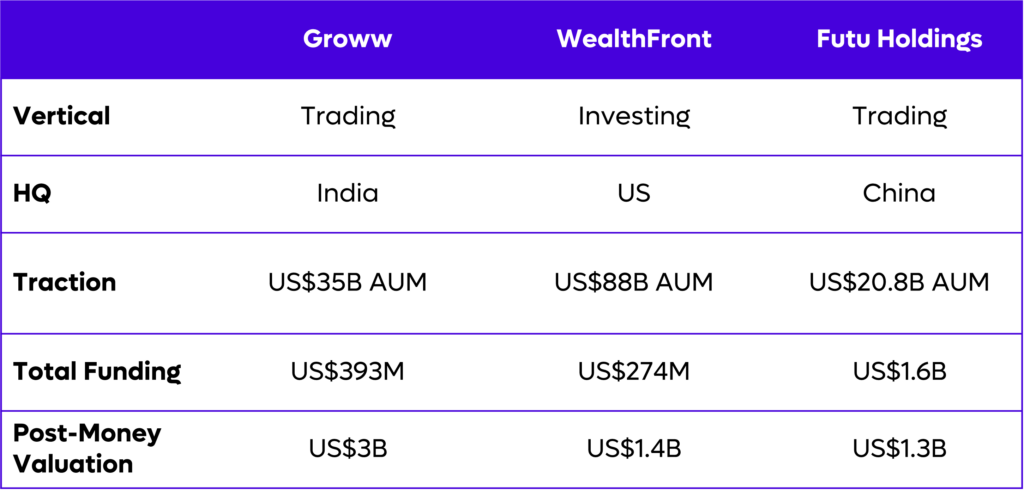
Figure 4 highlights 3 global precedents, used as case studies to identify key success factors in achieving sustainable growth in the Asset Management space. Below are the key findings from these case studies:
- Product: Integrated “all-in-one” digital platforms streamline investment activities (e.g., asset onboarding and investing) to offer low-cost alternatives to traditional managers, as shown by Wealthfront and Futu Holdings. Product expansions typically start with public assets (e.g., mutual funds) and then scale to alternatives/proprietary products to target untapped markets.
- GTM Strategy: Market expansion through capturing untapped consumer segments (i.e., young urban professionals) is driven by innovative product offerings (e.g., new products) and strong strategic partnerships with complementary businesses as seen from Groww.
- Revenue/Unit Economics: With commissions/fees capped at market averages, revenue growth highly depends on maintaining efficient active rates and keeping CAC lower than traditional players.
Spotting the Next Asset Management Champion in Southeast Asia
Diversified and digitally integrated investment and trading platforms targeting underserved segments will drive leadership in SEA Asset Management
Fig 5. SEA AUM1
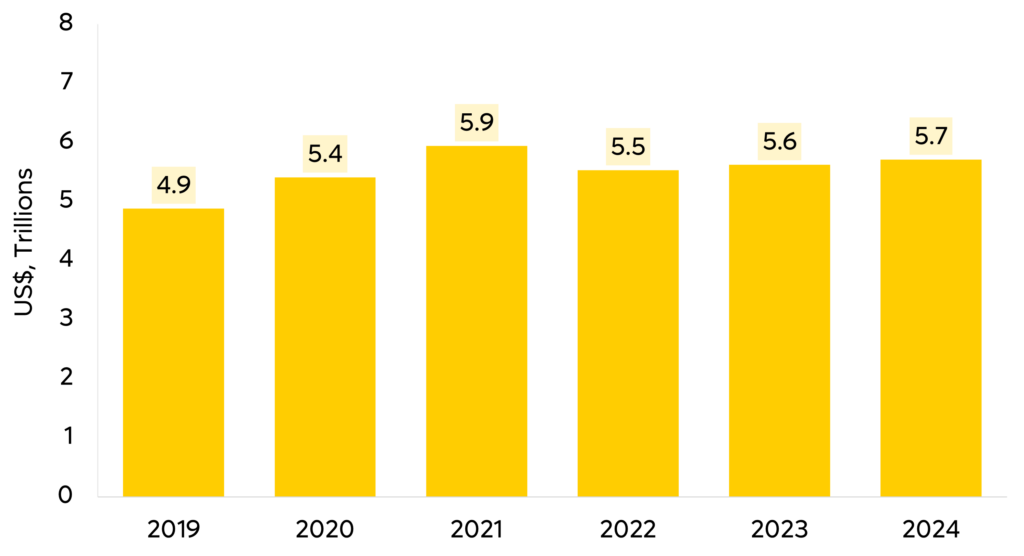
Opportunities in Southeast Asia
SEA AUM stands at US$5.5T in 2022 vs US$104T globally, with Singapore holding the bulk at US$4.9T. Regional AUM is expected to reach US$6.2T by 2028, growing at a 1.8% CAGR from 2022. SEA contributes just 5.3% of global AUM, with Singapore representing 88% of the regional total. Among SEA markets, Singapore leads in AUM and revenue size, while Vietnam records the fastest growth with 18.8% AUM growth and 26.4% revenue growth.
Several factors position this space for the emergence of regional market leaders:
- Rising HNWI Levels: SEA HNWI population is expected to grow at a steady 5.7% CAGR to reach 800,000 by 2027, with Singapore being the largest market and the Philippines being the fastest growing market (i.e., 7.8%.)
- Untapped Investment Potential in Emerging Markets: Vietnam (i.e., 6%) the Philippines (i.e., 2%), and Indonesia (i.e., 4%) remain below the ~18% AUM-to-GDP inflection point, indicating strong growth potential as their capital markets and financial systems mature.
Fig 6. AUM by Country (US$T)1

Key Takeaways
- High-Potential SEA Markets: While Singapore presents a mature market, Malaysia shows large potential as a mid-tier mature market with a healthy AUM/capita and strong HNWI focus. Though Indonesia and Vietnam are emerging with fast middle class and AUM growth.
- Diversified Product Offerings: Expanding beyond traditional asset classes (i.e., stocks, mutual funds) to include alternative investment products (i.e., direct indexing portfolio, next-gen assets) is essential to enhance product take rates.
- Capturing Untapped Segments: Engaging previously underserved markets (i.e., young urban professionals) through strategic partnerships (i.e., licensing companies) and product innovations is necessary to broaden market reach.
- Cost-Efficient Scaling: Sustainable and profitable scaling requires leveraging low-cost acquisition channels (i.e. ecosystem partnerships) to lower CAC and strategies that increase user retention, in order to preserve robust unit economics.